Feature / Health + wealth
When dealing with heath service funding,
the proportion of GDP (gross domestic product) spent on health, compared with other nations, seems to be broadly understood by voters. Yet, despite the prompting of NHS pressures groups and organisations – chiefly the

NHS Confederation – during the election campaign the political parties have seemed reluctant to commit to a fixed proportion of the country’s wealth to be spent on health.
There are other ways of measuring and comparing health expenditure. Spending per head is traditionally used to compare the four UK nations. Recently, with a rising and ageing population, it is seen as a good way of seeing how well the NHS is funded for demographic pressures.
However, discussion on the percentage of GDP spent on health is not new and is seen by economists as a good indicator of how much is being spent compared with other countries – it was highlighted during the 1987 general election, for example, when spending was around 6%. And, in 2000, Labour prime minister Tony Blair pledged an extra £12bn over six years to bring NHS spending in line with the European Union average. At that time, it meant a 5% a year real-terms rise in funding, bringing spending as a proportion of GDP from 6.7% to 8%.
In April, the Lords Select Committee on the Long-term Sustainability of the NHS said that if spending does not rise as fast as GDP for 10 years after 2020, the quality of and access to care will be ‘seriously affected’. It added that NHS funding was growing at a slower rate than GDP, when historically it tended to outstrip growth in the economy.
Though in this election politicians have shied away from linking health spending to GDP, the Conservative mantra of the past few years – that only by creating a strong economy can the country afford to increase spending on health – perhaps implicitly promises that health spending will increase as GDP rises. Despite the lack of political interest, the NHS Confederation believes the service and the public need the assurance of funding linked to GDP. Funding as a proportion of GDP has risen steadily over the years.
Before looking at the figures in detail, a word of warning. The figures bandied around are often accurate but include different spending pots when calculating the health spend as a proportion of national wealth. Generally when comparing countries, Organisation for Economic Co-operation and Development (OECD) figures are used – the UK figures are prepared for the OECD by the Office
for National Statistics. However, the OECD calculation of health spending is quite wide and includes some elements of social care (see box) and excludes capital spending (around 0.3% of GDP).
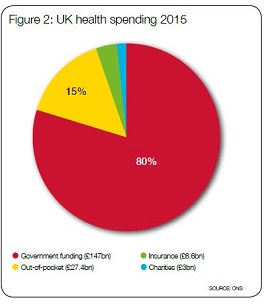
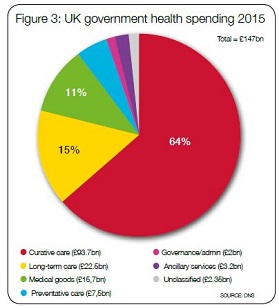
In 2015, the ONS put UK GDP at £1.8tr and UK health spending at around £185bn, with about 80% from government funding, 15% in out-of-pocket payments, more than 3% from voluntary health insurance and 1.6% in charity-funded care (see pie charts for breakdown).
But other bodies use different definitions. The Treasury, for example, uses a measure known as UK public health spending. That means public spending on health, rather than spending on public health, and includes all taxpayer spending including capital (though not some administrative costs). Other expenditure areas included are medical research, devolved administration health spending and local government spending on health. In 2015/16, public health spending, using this definition, stood at £140bn and accounts for 7.3% of GDP.
Assessing the main party election manifestos and using the Treasury definition, the Nuffield Trust said that health spending pledges by all parties would see the proportion of GDP spent on health fall in the next few years. Under Labour’s plans it would fall to 7.2%, while under the Liberal Democrats it would drop to 7.1% of GDP by the end of the Parliament. While it was unclear if the Conservative promise of an additional £8bn applied to NHS England or the wider Department of Health, the trust said that even under the most generous interpretation, spending would shrink to 7% of GDP.
International comparisons

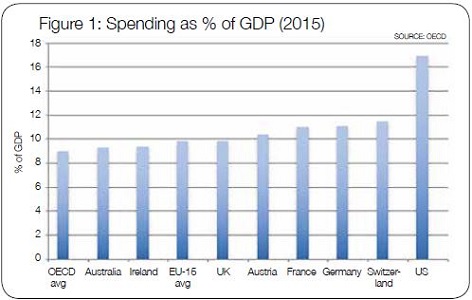
But how does the UK compare with other countries? According to the OECD figures (see figure 1 above), in 2015 the UK spent a little more than the Republic of Ireland and Australia (9.8% compared with 9.4% and 9.3% respectively). UK spending was the same as the average for the EU-15 countries – the members of the European Union prior to the 2004 enlargement that brought in seven former Eastern Bloc countries. The United States is an outlier worldwide at 16.9%.
Neighbouring countries in Europe spend more of their wealth on health, including the economic strongholds of Germany and France, which are often the benchmarks when assessing the strength of the UK economy.
NHS Confederation chief executive Niall Dickson argues that there is a precedent for linking spending to GDP, with defence spending set at 2% and international development 0.7%. ‘It would recognise there is a special place for health and care, as with the military and international development. As these two have demonstrated, setting a proportion holds politicians’ feet to the fire and makes them more accountable.’
The confederation has set no target for the proportion of GDP to be spent on health – that, it says, is for an incoming government. But it has looked at two scenarios and how they could affect health spending – maintaining the current 10% (it is around 9.8%) or being more ambitious and seeking to match the 11% spent in France and Germany.
The former would require an additional £16bn a year by 2022, and it assumes £12bn of this would come from the Exchequer – this was calculated using the proportion to government-funded care found in the ONS figures above (79.9%). The remaining £4bn would come from a variety of sources, such as out-of-pocket spending, private health insurance and charity funds.
Matching the French and German spending as a proportion of GDP would cost £20bn a year, the confederation says. Again, using the proportions in the ONS figures, £16bn would come from the government and £4bn from private sources.
The proportion of GDP spent on health is not just about the headline figure, but the balance of funding from the government, private sources, including insurance, and charities. If increasing the proportion of GDP, the country may have to decide where the balance should lie.
In most other countries, the bulk of the spending comes from national government. Nevertheless, in higher spending countries a greater proportion of overall health spending comes from private sources. According to the Institute for Fiscal Studies, while 79% of UK health spending in 2015 was publicly funded, the average in other EU-15 and G7 (world’s strongest economies) countries was 75%.
The US spends around the same as the UK on publicly funded healthcare as a proportion of GDP, but this accounts for less than 50% of the country’s total spend on health.
These international comparisons have led some commentators to suggest that the UK could increase its spending as a proportion of GDP by upping private funding, specifically through increasing co-payments.
Clearly, both scenarios considered by the NHS Confederation factor in an increase of £4bn in non-government funding, but could this mean more co-payments, such as for GP appointments?
Mr Dickson says: ‘At the moment, healthcare is nationally funded and free at the point of delivery and there seems to be a genuine consensus that that will remain. Social care has long been means tested and funded locally and again I don’t think we envisage any particular change in that.’
He adds that the Conservatives’ planned green paper on social care, should they win the election, could change the balance of public and private funding. 
Proportional argument
John Appleby, Nuffield Trust director
of research and chief economist, says in principle he does not see a problem setting NHS spending as a proportion of GDP at its current level. ‘It represents real growth of around 2% a year which is half the long-run [since the 1950s] average annual real growth and assumes we are content to remain about average with regard to other countries,’ he says.
‘It wouldn’t mean more co-payments – it would just mean keeping the NHS growing in line with growth in the economy. This assumes tax revenues et cetera also grow in line with GDP growth. But what happens when GDP doesn’t grow very much or falls in times of recession?’
GDP tends to rise, even if only by small amounts, though it contracts during recession – in this case, would health spending fall as the economy shrinks? Mr Dickson again: ‘It’s a legitimate point to make, but our argument is that when there is a recession, it is inevitable that a government will look at public spending.

We, and others, would make a strong case for protecting the most vulnerable in health and care. Historically, recessions have been short and it is unlikely during that time we would see big issues with health and care budgets. If a recession was prolonged, we could have a debate as a society about how much we want to spend on health and care.’
As we’ve seen, nailing down just how much the UK spends on health and how this compares internationally can be difficult. To bring some clarity, the confederation proposes setting up an Office for Budget Responsibility for health.
This has also been floated by the Lords Select Committee on the Long-term Sustainability of the NHS and promised in both the Labour and Liberal Democrat manifestos.
Mr Dickson says the independent body would strengthen the evidence base on which decisions are made.
‘I would like to see an objective assessment of funding needs as a one-off and then in future it could go through an OBR for health. This could project the future needs of health and care, be independent of government and provide indicative data on the proportion of GDP that’s appropriate. It could report on whether the government has done what it said it would do and whether the system is providing good value for money, which is an obligation on the system.’
Health spending as a proportion of GDP seems a straightforward measure, but it can be a minefield, with different elements of health and care spending included or excluded from calculations. However it is calculated, this election campaign has seen NHS bodies push for its use to assure the public that health services have the money they need to provide the care the public wants.
Proportional spending
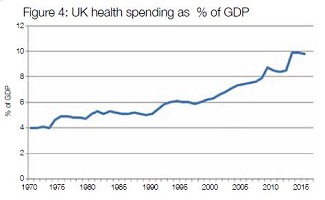
UK spending on health as a proportion of GDP has risen gradually over the years (see graph). In 1970, for example, it was about 4%, hitting 5% a decade later.

While in the 1980s spending stagnated at around 5%, the initial years of the 1990s saw a rapid climb as the purchaser-provider split was introduced. It had climbed to 6% by 1993 before plateauing again and being maintained during Tony Blair’s first administration.
But with Tony Blair’s promise in 2000 to increase health spending to the average level for the European Union, spending began to rise again. It increased from 6.3% of GDP in 2000, rising rapidly through the Blair/Brown years to 8.9% by 2009.
The Conservative/Lib Dem coalition government elected in 2010 imposed austerity on public services. Though the NHS was protected more than other parts of the public sector, it began to feel the effect of the squeeze on public spending. Health spending fell as a proportion of GDP during the early years of the coalition to 8.5%, but jumped to around 9.9% in 2013 and 2014. This is not due to an unnoticed multibillion-pound increase in actual spending, but changes in the way the figure is calculated.
The adoption of new definitions (known as the System of health accounts) developed by the OECD, has meant a reclassification of spending. In 2014, just under £9bn previously counted as health spending was no longer included, while more than £29bn that was attributed to other categories is now part of the calculation of health spending.
Out went capital spending and some out-of-pocket expenditure, but into the calculation came the carer’s allowance (£2.4bn in 2014), privately funded spending on long-term care (£9.5bn) and taxpayer-funded health-related social care (£13.5bn). Under the new rules, local authority nursing and residential care are now within the ambit of health spending.
Related content
We are excited to bring you a fun packed Eastern Branch Conference in 2025 over three days.
This event is for those that will benefit from an overview of costing in the NHS or those new to costing and will cover why we cost and the processes.