Finance function: distinguishing features
The English NHS finance function is made up of highly qualified, experienced and motivated people, who work long hours in the face of significant pressures, despite not always feeling valued. However, the relatively low number of women working in the most senior roles continues to be out of step with the overall gender mix of the function.
This picture is drawn from the latest finance staff census and staff attitudes survey. The biennial census, with the latest representing the position in the summer of 2017, is the result of a long-standing collaboration between the HFMA, Future-Focused Finance and the NHS Skills Development Network.
The staff attitudes survey is a parallel piece of work undertaken by the HFMA, in particular to help understand finance staff’s career paths to date and in future. The results of both pieces of work have been published in a briefing – The NHS finance function in 2017: England.
There have been no major reorganisations since the last census was undertaken in 2015. However, the NHS has faced significant challenges in this period, with financial settlements well below the long-run average. There have also been conflicting pressures on back-office costs, including those incurred by NHS finance functions.
While finance teams have a key role in the delivery of financial control totals, they have also faced increased pressure to support the delivery of new models of care as part of broader NHS transformation plans.
Lord Carter’s 2016 report on acute hospital productivity increased the pressure to improve efficiency and also triggered the compilation of wide-ranging data (for initiatives such as NHS Improvement’s Model Hospital and Getting it right first time). And the roll-out of NHS Improvement’s Costing Transformation Programme has also gathered pace, creating a need to invest in the costing process itself and support an increased use of patient-level cost data to inform improvement.
All of this has combined to increase the demands on finance teams. However, the Carter report also put a specific focus on reducing back-office costs, including those of the finance function.
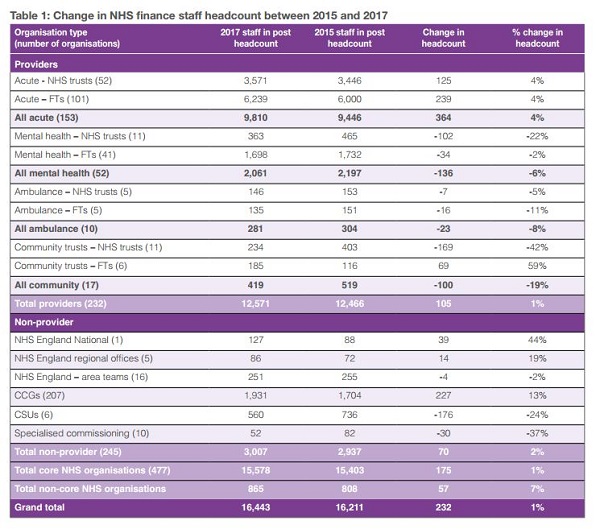
Against this backdrop, the census shows that finance function headcount in England has stayed relatively static – with the latest headcount of 16,443 representing a small increase of 232 – or just under 1.5% – compared with 2015. This is based on 510 organisations, including a core NHS of 232 NHS providers and 245 commissioning bodies.
Looking specifically at these core NHS organisations, an overall increase of 175 staff masked increases and decreases within the different types of organisations. For example, there are an extra 364 staff (up 4%) working in acute providers compared with 2015, while both mental health providers and dedicated community providers saw a fall in numbers (-6% and -19% respectively).
Similarly, a 227 increase in clinical commissioning group staff, representing a 13% increase, needs to be seen alongside a 24% reduction in finance staff working in commissioning support units and a 37% reduction in specialised commissioning staff.
Overall, provider staff account for 76% of NHS finance staff, while 18% work in commissioning and commissioning support. Of the 12,571 staff working in providers, 8,257 (66%) work in foundation trusts and 9,810 (78%) work in the acute sector. Of the 3,007 non-provider staff in the core NHS, 1,931, 64% work in CCGs (see table 1).
Looking at the number changes a different way, the average size of an acute provider finance team has increased by three staff to 64. There have been bigger increases in average acute trust teams (increased by six) compared with foundation trusts (increased by two).
Team size and turnover
However, team size is very dependent on turnover. Acute providers with a turnover of more than £500m now have an average team size of 108, compared with 32 in a trust of £100m-£200m. The average size of a mental health provider team is 40, with average teams ranging from 24 to 60 depending on turnover (although there are no mental health trusts with a turnover above £500m).
The average CCG team is just nine staff, up one since 2015 – although there are two fewer CCGs this time around. However, a number of CCGs share chief finance officers and finance teams and there have been some mergers since the census was conducted.
The national small increase in staff headcount was mirrored in three of the four NHS regions. Numbers rose in the North (up 2.9% to 5,471), London (up 1.5% to 2,884) and South (up 3.5% to 3,632) and reduced in the Midlands and East (down 2% to 4,456). London had the greatest proportion of agency staff, but all regions place some reliance on agency to cover vacancies.
The census does not give a complete picture of the use of outsourcing in NHS financial services. However, just 19% of provider trusts reported this time that they outsource none of their activities, compared with 25% in 2015 – suggesting an increase in the use of outsourcing. There has also been an increase in the proportion of staff identified as financial management (55%), which is consistent with a function that is outsourcing its more transactional services.
The census also provides a detailed breakdown of the finance function by Agenda for Change (AFC) pay band. Some 42% of the function are band 7 or above (including finance directors and senior managers not on Agenda for Change rates). A further 25% are at bands 5 and 6, the remainder at bands 1 to 4.
The census report highlights London as having the largest proportion of senior staff, with some 49% paid at grade 7 up to very senior manager level (up from 47%) and only 21% in bands 1-4.
There were 427 finance directors across the 477 organisations in the core NHS, the mismatch in numbers reflecting some shared arrangements and different structures in some commissioning organisations.
There were 151 chief finance officers across 207 CCGs, but more ‘directors’ than organisations in provider bodies – reflecting some instances of executive chief finance officer posts alongside director of finance roles.
Women directors
The census also revealed a small increase in the number of finance director positions occupied by women – now accounting for 28% of all director posts compared with 26% in 2015. However, the proportion remains low compared with the make-up of the overall NHS finance workforce, where women account for 61% of all staff. Women outnumber men in every band up to and including band 8b. From band 8c upwards, this position is reversed.
A second collection of ethnicity data continues to show that the function is 70% white British (compared with 72% in 2015).
The mix looks completely different in London, where just 34% of staff identify as white British. However, ethnicity was not disclosed for one in four staff in London compared with just over one in 10 across the whole country.
The function is also highly qualified, with some 7,082 staff (45%) holding a CCAB qualification or equivalent (32%) or studying for one (13%). Within this professionally qualified cohort, the CIMA qualification is the single biggest choice – representing 47% of qualified or studying staff. Another 12% of the function are qualified with or studying for AAT. It also boasts significant amounts of experience (see box).
‘At the overall level, the figures show only a small increase in numbers from 2015,’ says Emma Knowles, HFMA head of policy and research. ‘But the demands on finance staff have increased significantly in the last two years – and continue to increase.
‘Roughly the same number of finance staff are overseeing a bigger budget and are supporting the achievement of major efficiency demands to meet challenging control totals. They also have a major role in supporting the transformation of the NHS and the development of new models of care.’
Given these extra demands, she added that it was encouraging to see job satisfaction was only down a fraction compared with 2015. However, she said the fact that many senior staff in particular were having to work additional hours (up to an extra 20 hours per week) was not sustainable.
‘Frontline staff have been under significant pressure in the face of unrelenting demand. But these pressures are also felt in support services and we need to ensure that services are funded and managed in a way that is fair to all staff and sustainable for the future.’
Experience, satisfaction, motivation
The HFMA’s finance staff attitudes survey reinforces the census finding that the function is highly qualified. But it also suggests that the function also possesses significant amounts of experience.
There were more than 600 responses to the survey, with the majority having an accountancy qualification or studying for one, and more than one in four had spent more than 10 years with their current organisation.
Over 40% had been with their current organisation for at least five years.
One in three of the sample had spent their entire careers in the NHS. Nearly two-thirds of the rest had spent time in the private sector.
Job satisfaction is skewed towards the higher end of the scale, with a mean of 6.6 out of 10 (6.7 in 2015). Concerns raised tended to focus on: worsening NHS finances; increased workload and falling pay in real terms; and job insecurity.
Job satisfaction increases with seniority, although comments suggest many are under great pressure. Some 70% of respondents work more than their contracted hours at least once a week, with 22% reporting that they always work in excess of contracted hours.
More than one in three of the most senior staff (band 8d and above) said they always work additional hours – although this is a slight decrease on the findings in 2015.
These levels of additional hours were reported to be more than 20 hours a week in some cases.
Three quarters of respondents said they were happy with the level of career development they were given – however, just 40% of 134 deputy or assistant finance directors wanted to become a finance director.
Most finance staff (80%) felt valued by their line manager, with half this number feeling valued by clinicians. One in four felt valued by other organisations across their local system but only a very few felt valued by the public (7%) or the government (10%).
Finance staff, however, remain motivated to work in the NHS, with 67% citing public sector values and 56% driven by the opportunities to improve patient care.
There were roughly even numbers of staff who believed the finance function was the right size or too small, with just a small remainder of 10% thinking it was currently too big. However nearly 60% thought that it would be smaller by 2020/21.


Related content
We are excited to bring you a fun packed Eastern Branch Conference in 2025 over three days.
This event is for those that will benefit from an overview of costing in the NHS or those new to costing and will cover why we cost and the processes.